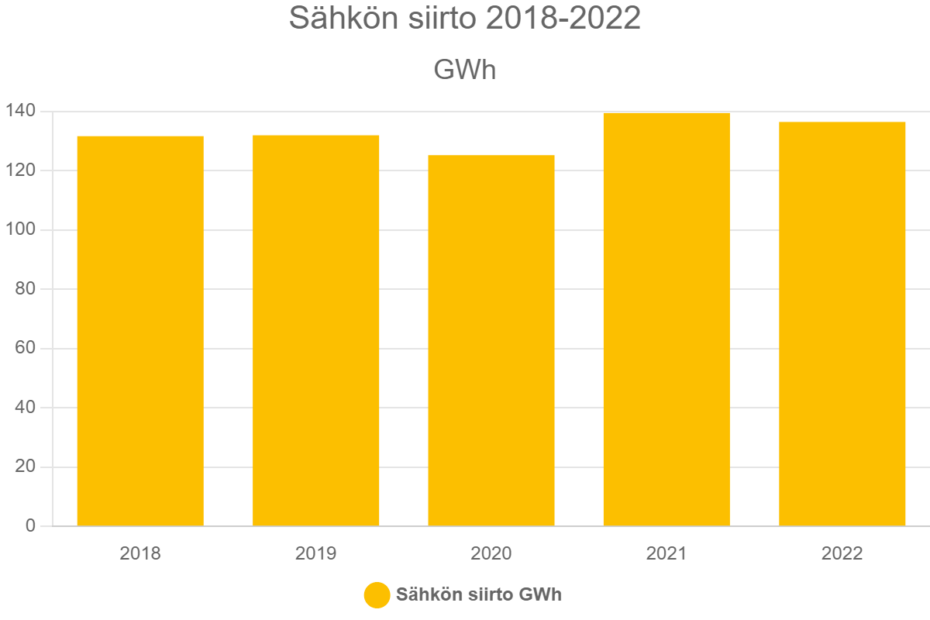
Sähkön siirto 2018-202211.1.20247.2.2024 Liittyvät artikkelit Juhannuksen poikkeusaukioloajat Kesämökin sähkönkulutus – mistä se koostuu? Asiakaspalvelu suljettu perjantaina 6.6.2025