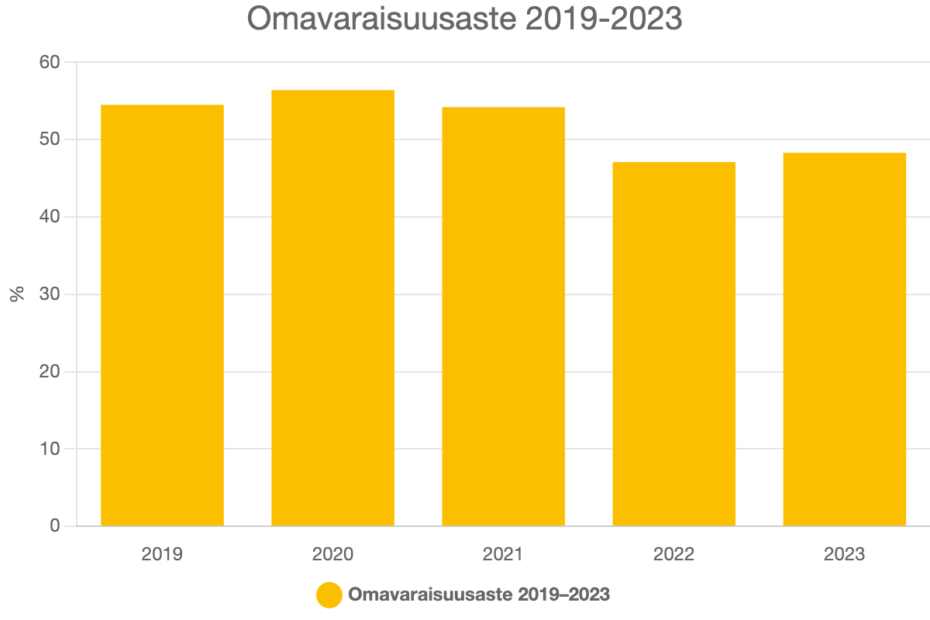
Column chart. Data table with 6 rows and 2 columns follows.
| Omavaraisuusaste 2019–2023 | |
|---|---|
| 2019 | 54,5 |
| 2020 | 56,4 |
| 2021 | 54,2 |
| 2022 | 47,1 |
| 2023 | 48,3 |

Column chart. Data table with 6 rows and 2 columns follows.
| Omavaraisuusaste 2019–2023 | |
|---|---|
| 2019 | 54,5 |
| 2020 | 56,4 |
| 2021 | 54,2 |
| 2022 | 47,1 |
| 2023 | 48,3 |