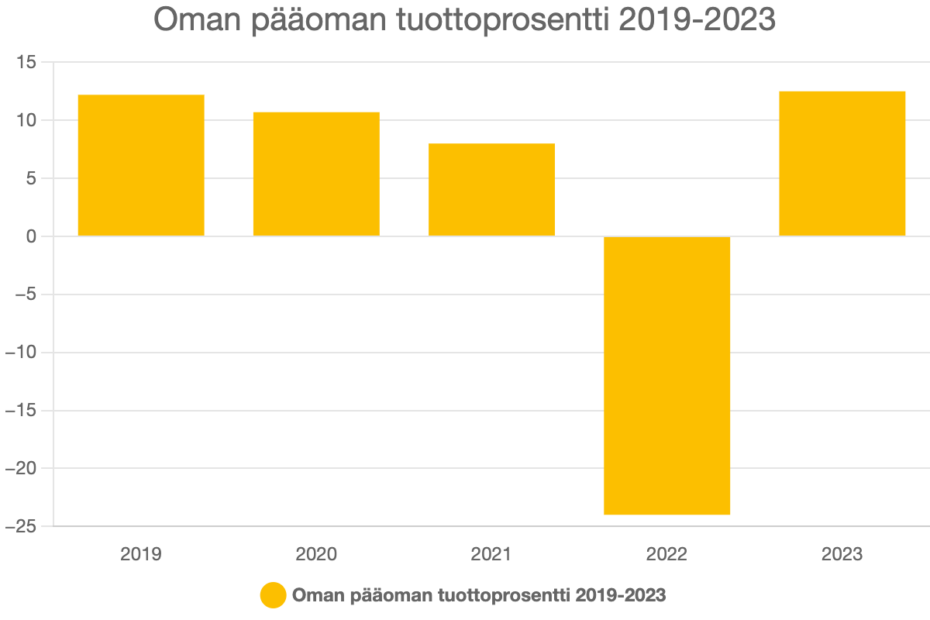
Oman pääoman tuottoprosentti 2019-202323.4.20244.4.2025 Liittyvät artikkelit Kuivalahden johtolähdössä sähkökatko Juhannuksen poikkeusaukioloajat Kesämökin sähkönkulutus – mistä se koostuu?